| SILKYPIX® | SOFTWARE MANUAL |
| 6. Useful Functions for Adjustment | ||||||||
- This software has warning function to support the parameter adjustment.
6.1 Highlight/Shadow/Outside of the Color Gamut Warnings
 When you click the
  button, you can specify each warning.
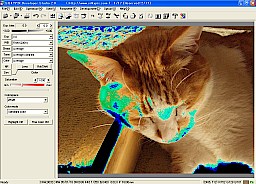
A warning will be displayed blinking on the picture in preview mode.
(1) Enable Highlight warning
 The place where lightness and color are saturated blinks.
The place where lightness is saturated blinks in black and where the lightness is underexposed blinks in white.
This function is convenient for adjusting exposure.
In addition, since a warning is given for a saturated color in an inversion color (negative), you can use it conveniently when you adjust saturation.
 This gives a warning for the shadow portion that seems to be black in contradiction to the highlight warning.
- This gives both the
 highlight warning and shadow warning simultaneously.
 This gives a warning for the portion where saturation is higher outside of the color gamut.
Refer to '10.7 Creating Color Gamut and Adjusting Outside of the Color Gamut' about the color gamut.

 The menu [View(V)] - [Tone curve(T)] starts up the "Tone curve" dialog.
 You can set the curve which exchanges lightness while editing a picture. The horizontal axis means input (brightness of source picture) and the vertical axis means output (brightness of result picture after exchange). You can control lightness in a picture by operating this curve.
* By dragging window's frame of the "Tone curve" dialog, you can adjust a size of the dialog.
In addition, by dragging it while pressing the Shift key, you can adjust the size while fixing aspect ratio of it.
6.2.1 Editing Points
 The curve is drawn as passing through a point, and you can operate the curve by moving the point. During the operation, coordinates are displayed at the right side of the "Init all" button. Guide display function: When there is a cursor on the preview, a value of the position is displayed.
 (1) Adding Point
- Click the mouse on a graph to place a point at the position.
- Move the mouse cursor around the point that already exist The cursor image changes to the {crosshair cursor}.
Drag the mouse in this state to move the existing point.
- Move and right-click the mouse on the target point to delete.
In addition, you can delete the current point by pressing the Delete key. You can delete up to the last two points.
- The point displayed in red is the current point, which is the last point you operated.
By pressing the Delete key, you can delete this current point.
(1) Type Combo Box ¥¥¥You can select the value which you want to operate a gradation process in a combo box.
| RGB | Set gradation process for all RGB values with the tone curve. |
| R | Set gradation process for R value with the tone curve. |
| G | Set gradation process for G value with the tone curve. |
| B | Set gradation process for B value with the tone curve. |
(2) "Init" button ¥¥¥Initializes the lightness setting.
(3) "Init all" button ¥¥¥Initializes the all tone curve settings of RGB, R, G, and B.
(4) Guide display ¥¥¥Displays a value of position where a cursor is on.
(5) "Add point" button ¥¥¥Adds a point on the presently selected type of tone curve by moving the eyedropper icon on the preview and clicking the point to edit (By clicking the point while pressing the Ctrl key, you can add a point on all tone curves of RGB, R, G, and B).
* '(4) Guide display' and '(5)"Add point" button' are valid only when all points are monotone increasing or monotone decreasing.
- Regarding "Tone curve", you can select the following two types.
 (1) "Straight" Connects placed points with a line segment.
 (2) "Curve" Connects placed points with the smooth curve which passing through the points.
- The menu [View(V)] - [Histogram(H)] starts up the "Histogram" dialog.
 "Histogram" displays a brightness distribution on a picture. You can check which part of the picture has what kind of brightness.
The horizontal axis means brightness (0 - 255), and the more it goes to the right side, the more brightness increases. The vertical axis means the number of pixels that corresponds to its brightness.
R, G, and B are displayed in each color on a graph, and the place where these overlap is displayed in additive color mixture.
6.3.1 Histogram: Mode
- You can select the following two modes for display.
 (1) Auto
- The scale on the vertical axis of a histogram is set to the most suitable value automatically for a picture.
 (2) Manual
- You can adjust the scale on the horizontal axis of a vertical manually.
You can adjust the scale on the axis by operating the below slider. The scale gets rough as you move it to the left side, and it gets minute as you move it to the right side.
- The arrow displayed on the gray scale at the bottom has the following meanings.
 (1) Contrast center
- This indicates a contrast center of tone.
 (2) RGB marker
- This displays a RGB value of the point which is the mouse cursor is on. The value corresponds to brightness position on a graph.
It is very effective to check where a color of a point on a screen is distributed on a histogram.
- Shortcut keys and function keys that you can use in this software are shown below.
* These are default settings, and you can customize the keys. Refer to '9.6 Key Setting (Customizing).'
6.4.1 Operating Menu Bar
- 6.4.1.1 File
| Open file | Ctrl + O |
| Open folder | Ctrl + F |
| Development | Ctrl + S |
| Ctrl + P |
| Undo | Ctrl + Z |
| Redo | Ctrl + Y |
| Select all scene | Ctrl + A |
| Copy development parameter | Ctrl + C |
| Paste development parameter | Ctrl + V |
| Initialize development parameter | Ctrl + X |
| Rotate CW (+90 degree) | Ctrl + R |
| Rotate CCW (-90 degree) | Ctrl + E |
6.4.1.4 Display
| Previous scene | F11 |
| Next scene | F12 |
| Switching display floating/control | F9 |
| Display grid | Ctrl + G |
| Histogram | Ctrl + H |
| Tone curve | Ctrl + M |
| Trimming setting | Ctrl + T |
| Copy development parameter | Ctrl + C |
| Paste development parameter | Ctrl + V |
| Initialize development parameter | Ctrl + X |
| Rotate CW (+90 degree) | Ctrl + R |
| Rotate CCW (-90 degree) | Ctrl + E |
| Development | Ctrl + S |
| Help | F1 |
- 6.4.2 Operating Context Menu
- 6.4.2.1 Image Display Size Adjustment
| Zoom in | Shift + ↑ |
| Zoom out | Shift + ↓ |
| 100% | Shift + → |
| Whole display | Shift + ← |
| Delete mark | F6 |
| Copy/Move-mark | F7 |
| Reserve | F8 |
| Development | Ctrl + S |
| Previous scene | F11 |
| Next scene | F12 |
- 6.4.3 Shortcut Key List
| Key | Operation | Single Selection | Multiple Selection | Preview Mode | Besides RAW Data |
| F1 | Help | ||||
| F2 | Exposure bias tool | ||||
| F3 | Gray balance tool | ||||
| F5 | Preview update | ||||
| F6 | Delete mark | ||||
| F7 | Copy/move mark | ||||
| F8 | Reserve | ||||
| F9 | Switching floating control display | ||||
| F11 | Previous scene | ||||
| F12 | Next scene | ||||
| Ctrl + A | Select all scene | ||||
| Ctrl + C | Copy development parameter | ||||
| Ctrl + E | Rotate CCW (-90 degree) | ||||
| Ctrl + F | Select folder | ||||
| Ctrl + G | Display grid | ||||
| Ctrl + H | Histogram | ||||
| Ctrl + M | Tone curve | ||||
| Ctrl + O | Select file | ||||
| Ctrl + P | |||||
| Ctrl + R | Rotate CW (+90 degree) | ||||
| Ctrl + S | Development | ||||
| Ctrl + T | Trimming setting | ||||
| Ctrl + V | Paste development parameter | ||||
| Ctrl + W | Switch display mode | ||||
| Ctrl + X | Initialize development parameter | ||||
| Ctrl + Y | Redo | ||||
| Ctrl + Z | Undo | ||||
| Ctrl + 0 | Display magnification: Whole display | ||||
| Alt + Ctrl + 0 | Display magnification: 100% | ||||
| Ctrl + + | Display magnification: Zoom in | ||||
| Ctrl + - | Display magnification: Zoom out | ||||
| Shift + ↑ | Display magnification: Zoom in | ||||
| Shift + ↓ | Display magnification: Zoom out | ||||
| Shift + → | Display magnification: 100% | ||||
| Shift + ← | Display magnification: Whole display | ||||
| PageUp | Scroll Up | ||||
| PageDown | Scroll Down | ||||
| Home | Scroll to head | ||||
| End | Scroll to end |